
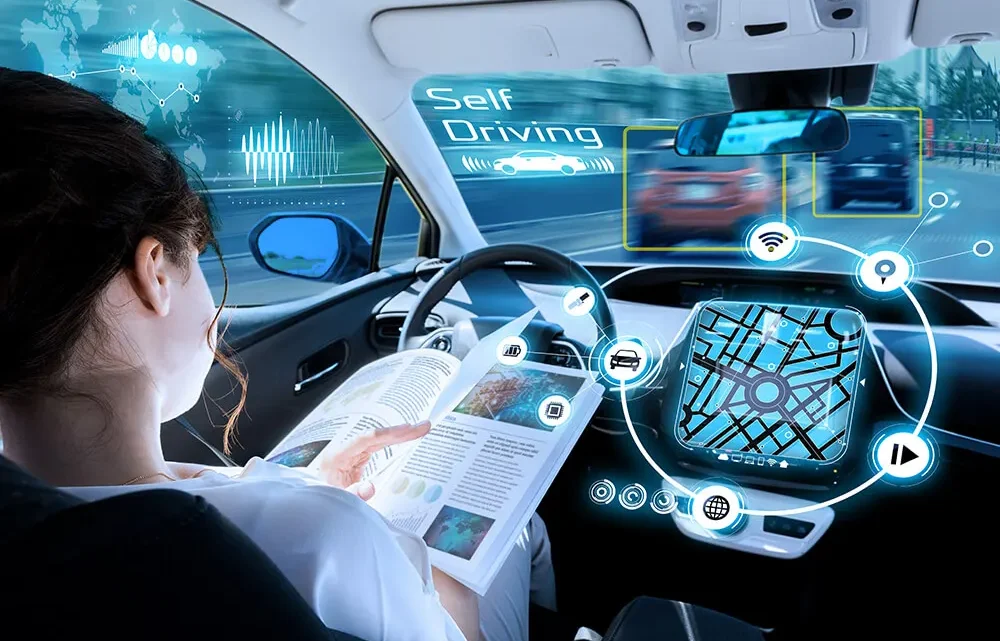
How Self-Driving Cars Make Split-Second Decisions
Sensors spot a hazard in milliseconds, but the hardest calls come in the gap between seeing it and deciding what it is.
The most studied self-driving crash on record did not happen because a computer was too slow. In Arizona, an Uber test vehicle, a modified Volvo SUV, registered Elaine Herzberg on radar about six seconds before it struck and killed her.
In those six seconds, the software called her an unknown object, then a vehicle, then a bicycle, and each label carried a different guess about where she would go.
Trending Now!!:
At 1.3 seconds out, it concluded that emergency braking was needed. The car did not brake: Uber had switched off that function under computer control “to reduce the potential for erratic vehicle behavior,” leaving a human safety driver to intervene.
A self-driving car decides by repeating a loop many times a second: sensors build a three-dimensional picture, software identifies objects and predicts their paths, a planner scores candidate trajectories, and a controller executes the best one.
A separate safety layer can override the plan instantly. Speed is rarely the weak point; judgment under uncertainty is.


That reframes the usual debate. Reflexes are cheap for a computer. The expensive part is knowing what is out there, guessing what it will do and choosing a response that is safe, legal and tolerable to the passengers, all from data that is often ambiguous.
The Loop Behind Every Decision
Autonomous driving software is usually described as four stages: perception, prediction, planning and control. Perception turns raw sensor data into a list of tracked objects.
Prediction estimates where each one will be over the next several seconds. Planning picks a path and a speed. Control converts that choice into steering, throttle and brake commands.
Most developers have built the stack as separate modules, which makes failures easier to trace. A growing camp, including the British company Wayve, trains a single neural network to map sensor input straight to driving behavior by imitating expert human drivers.
The trade-off is familiar: modular systems are easier to inspect and certify, while end-to-end systems learn the connections between stages without a human specifying them.
Nothing in the loop waits politely for the last decision to finish. Sensors typically refresh at ten times a second or faster, and each refresh can overturn the plan. One published prototype for cooperative driving reported end-to-end processing of about 80 milliseconds.
Latency matters because the car keeps moving. At 45 miles per hour, roughly 20 meters per second, every 100 milliseconds of delay is about two meters of road covered on stale information. At 65 miles per hour, it is closer to three.
That arithmetic works as a rule of thumb: each tenth of a second of pipeline delay costs about half a car length at city speeds. Engineers care about the slowest cycles, not the average, because a rare spike in processing time at the wrong moment is what shows up in a crash report.
Seeing Before Deciding
Every decision starts with what the sensors can establish. Waymo’s sixth-generation system combines 13 cameras, 4 lidar units, 6 radar units and external audio receivers, with overlapping fields of view reaching 500 meters in every direction.
Each sensor type covers for the others. Lidar paints a three-dimensional point cloud that gives the size and distance of objects. Radar measures speed directly and keeps working in rain, fog and snow. Cameras read color, signs, signals and gestures. When glare or weather limits a camera, lidar and radar maintain the picture.
Other developers make a different bet. Tesla leans mainly on cameras and neural networks, wagering that software can infer the depth and motion that other systems measure directly.
The approach is cheaper per vehicle. Whether it matches multi-sensor redundancy across weather and lighting extremes is still argued over, and the argument should be settled by crash and intervention data rather than by sensor counts.
Sensors alone do not make decisions safe. The Uber vehicle had radar and detected the pedestrian at a range that left more than enough time to stop.
At 43 miles per hour, six seconds is about 115 meters, several times the roughly 26 meters the car needed to stop under hard braking on dry pavement, an assumed deceleration of 7 meters per second squared. Seeing the problem and understanding the problem are separate achievements.
Guessing What Everyone Else Will Do
Prediction is where driving stops being geometry and becomes social. A parked delivery van, a pedestrian at a curb and a car with a turn signal on all have futures that branch.
Modern systems typically carry several hypotheses for each moving object, with probabilities attached, and the planner must find a path that stays safe across the plausible ones.
Consider a hypothetical: a cyclist rides alongside a row of parked cars, and a door might open. A cautious planner does not wait for the door to open. It widens the gap and trims speed as soon as the possibility exists, because the cost of slowing is small and the cost of being wrong is large.
The Uber case shows what happens when the forecast never stabilizes. According to the NTSB, the software classified Herzberg as an unknown object, as a vehicle, and then as a bicycle, with varying expectations of her future path.
A system that cannot settle on a label cannot settle on a trajectory. A conservative design would treat any unclassified moving object that intersects the planned path as an obstacle, whatever its label.
That is analysis rather than a quotation from the investigation, but it captures the principle: uncertainty about what something is should raise caution, not lower it.
Picking One Path From Thousands
Given a set of predictions, the planner generates candidate trajectories: stay in lane at the current speed, slow gradually, nudge left, stop, change lanes.
Each candidate is scored against a cost function that weighs collision risk, compliance with traffic law, passenger comfort and progress toward the destination. The lowest-cost option wins, and the process restarts a fraction of a second later.
Two details matter more than they appear to. First, some rules behave as hard constraints rather than costs. A trajectory that runs a red light is not penalized; it is discarded. Second, the weights encode a values judgment.
Tune comfort too high and the car brakes late to avoid a jolt. Tune caution too high, and it stalls traffic, blocks intersections and invites aggressive behavior from the humans around it.
The Uber braking decision was exactly this trade-off made badly: smoothness was prioritized over a hard stop. Every developer faces the same tension, and the fix is rarely a single number. It is a long list of scenarios tested in simulation and on the road until the behavior is acceptable in all of them.
The Veto Layer That Can Override the Plan
Because planners optimize, a second layer is often added to constrain. The best-known formal version is Responsibility-Sensitive Safety, proposed by Mobileye.
It translates intuitive rules of careful driving into math: keep a safe following distance, do not cut in recklessly, treat right of way as something given rather than taken, take extra care where visibility is limited, and avoid a crash when doing so does not cause another.
The following-distance rule shows how it works. The model computes a minimum safe gap from both vehicles’ speeds, the system’s response time and assumed braking capability.
The moment the real gap drops below that minimum, the car brakes until the margin is restored or it stops. It is the two-second rule that human drivers apply by feel, made precise enough to verify.
This layer has two limits worth knowing. A formal safety rule is only as good as the world model feeding it; if perception mislabels an object or misjudges its speed, the rule computes a safe answer to the wrong question. And a veto only counts if it is allowed to act. In the Arizona crash, the factory emergency braking existed and was disabled.
Where Machines Beat Human Reflexes, and Where They Do Not
The comparison with human drivers is usually told as a reaction-time contest, and on that narrow measure the machine wins easily. Research on braking response finds that drivers who know exactly when and where a signal will come need about 0.7 to 0.75 seconds.
A common but unexpected signal, such as a lead car’s brake lights, takes about 1.25 seconds. A true surprise, like an object suddenly entering the road, takes roughly 1.5 seconds.
Even in a study from MIT where drivers had just glanced back at the road, younger drivers needed around 220 milliseconds to detect a hazard and 388 to decide how to avoid it, while drivers aged 55 to 69 needed about 403 and 605.
Convert those into distance, and the gap is stark. A human responding to a surprise at 45 miles per hour travels about 30 meters before touching the brake. A system that responds in 0.2 seconds travels about 4.
Add the same hard-braking distance of roughly 29 meters (an assumed 7 meters per second squared) and the totals are about 59 meters for the human and 33 for the machine in this hypothetical.
Machines also never look at a phone, never tire, and watch all directions at once. Their weakness is different: they are brittle on situations they were never shown. A human who sees something odd improvises.
A system facing a configuration outside its training may do something confident and wrong. Reaction time is therefore a misleading headline metric. The useful question is how the system behaves in the first second after something unusual appears.
Edge Cases That Broke the Logic
Two recent episodes show failures of judgment rather than speed.
In San Francisco, a human-driven car struck a pedestrian in an adjacent lane and threw her into the path of a Cruise robotaxi, which then hit her.
The system classified the impact as a side collision and attempted a pullover maneuver, a routine response meant to get the vehicle out of traffic, instead of staying put. It dragged the woman about 20 feet.
Reviews found that the vehicle had detected and tracked its surroundings correctly up to that point; the failure was the post-collision decision. Cruise recalled 950 vehicles with a software update, and the company halted driverless operations.
Waymo faced a different test. School districts, led by Austin, documented vehicles passing school buses that had flashing red lights and extended stop arms. Waymo said its software caused some vehicles to slow or stop for a bus and then proceed, and it recalled 3,067 vehicles.
Regulators later opened a query into whether the fix worked, noting that most of the incidents occurred after the update was deployed. These errors are not geometry problems. The bus was visible. What went wrong was interpreting a rule that depends on context: lights, signs and the presence of children.
Both cases teach the same lesson. Edge cases sit in the semantics of driving, in what a situation means and what the law requires, and a single patch rarely closes a category.
Why the Trolley Problem Misleads
Popular coverage fixates on a dilemma: swerve and hit one person, or stay and hit five. Real systems almost never face this choice, and the framing hides where ethics actually operates.
By the time a forced-choice crash exists, earlier decisions have already failed. The meaningful moral choices are made much sooner, in how fast to approach a blind driveway, how much margin to leave a cyclist, and how aggressively to merge.
Consider a hypothetical: a car approaching a crosswalk partly hidden by a stopped truck. Slowing to a crawl costs the passengers ten seconds. Not slowing risks a collision that no braking could prevent.
The system’s value judgments are expressed in those margins, which is why published rules, recall records and crash data say more about a vehicle’s ethics than any philosophy seminar scenario.
What the Crash Data Does and Does Not Show
Waymo, an Alphabet subsidiary operating at SAE Level 4, has driven 271.3 million rider-only miles, meaning miles with no human behind the wheel, and now provides about 500,000 paid rides a week across 10 US cities.
Across all its locations, its published serious-injury-or-worse crash rate is 0.01 per million miles against a human benchmark of 0.21, and its any-injury rate is 0.67 against 3.77. The company states that this is 95 percent fewer serious-injury crashes, a gap of 55 fewer crashes than humans would be expected to have over the same distance.
Three caveats apply. The data comes from the operator itself, although a peer-reviewed analysis at 56.7 million miles used the same method. The benchmarks are built from police-reported crashes and mileage data, adjusted for underreporting, in the cities where the vehicles operate.
And the service runs inside mapped areas, mostly on surface streets, so the numbers say little about every road, every storm or every driver. Fatal crashes are too rare to compare reliably at this mileage.
A Checklist for Reading Safety Claims
A few questions separate informative safety claims from promotional ones:
- Whether the miles were driven with no human on board or under supervision, since a safety driver changes what the software is being tested on.
- Whether the human benchmark covers the same cities, road types and conditions.
- Which severity level the comparison uses, because injury and airbag crashes carry more statistical weight than minor contact.
- Whether fixes held after recalls, which the Waymo school-bus episode makes a live question.
A crash-rate claim deserves trust only when it names its miles, its benchmark and its severity threshold. If any of the three is missing, the number is marketing.
What People Ask